Where is Mexico's GDP produced?
Half of Mexico's GDP is produced in a strip 250 km wide, but per person the centre stops standing out and output falls from north to south.
Code on GitHubHalf of Mexico's GDP is produced in a strip 250 km wide from north to south, between 18.5° and 20.75° north. It runs from Guadalajara to Veracruz through Mexico City. From east to west, half fits in 340 km, between Mexico City and León, Guanajuato.
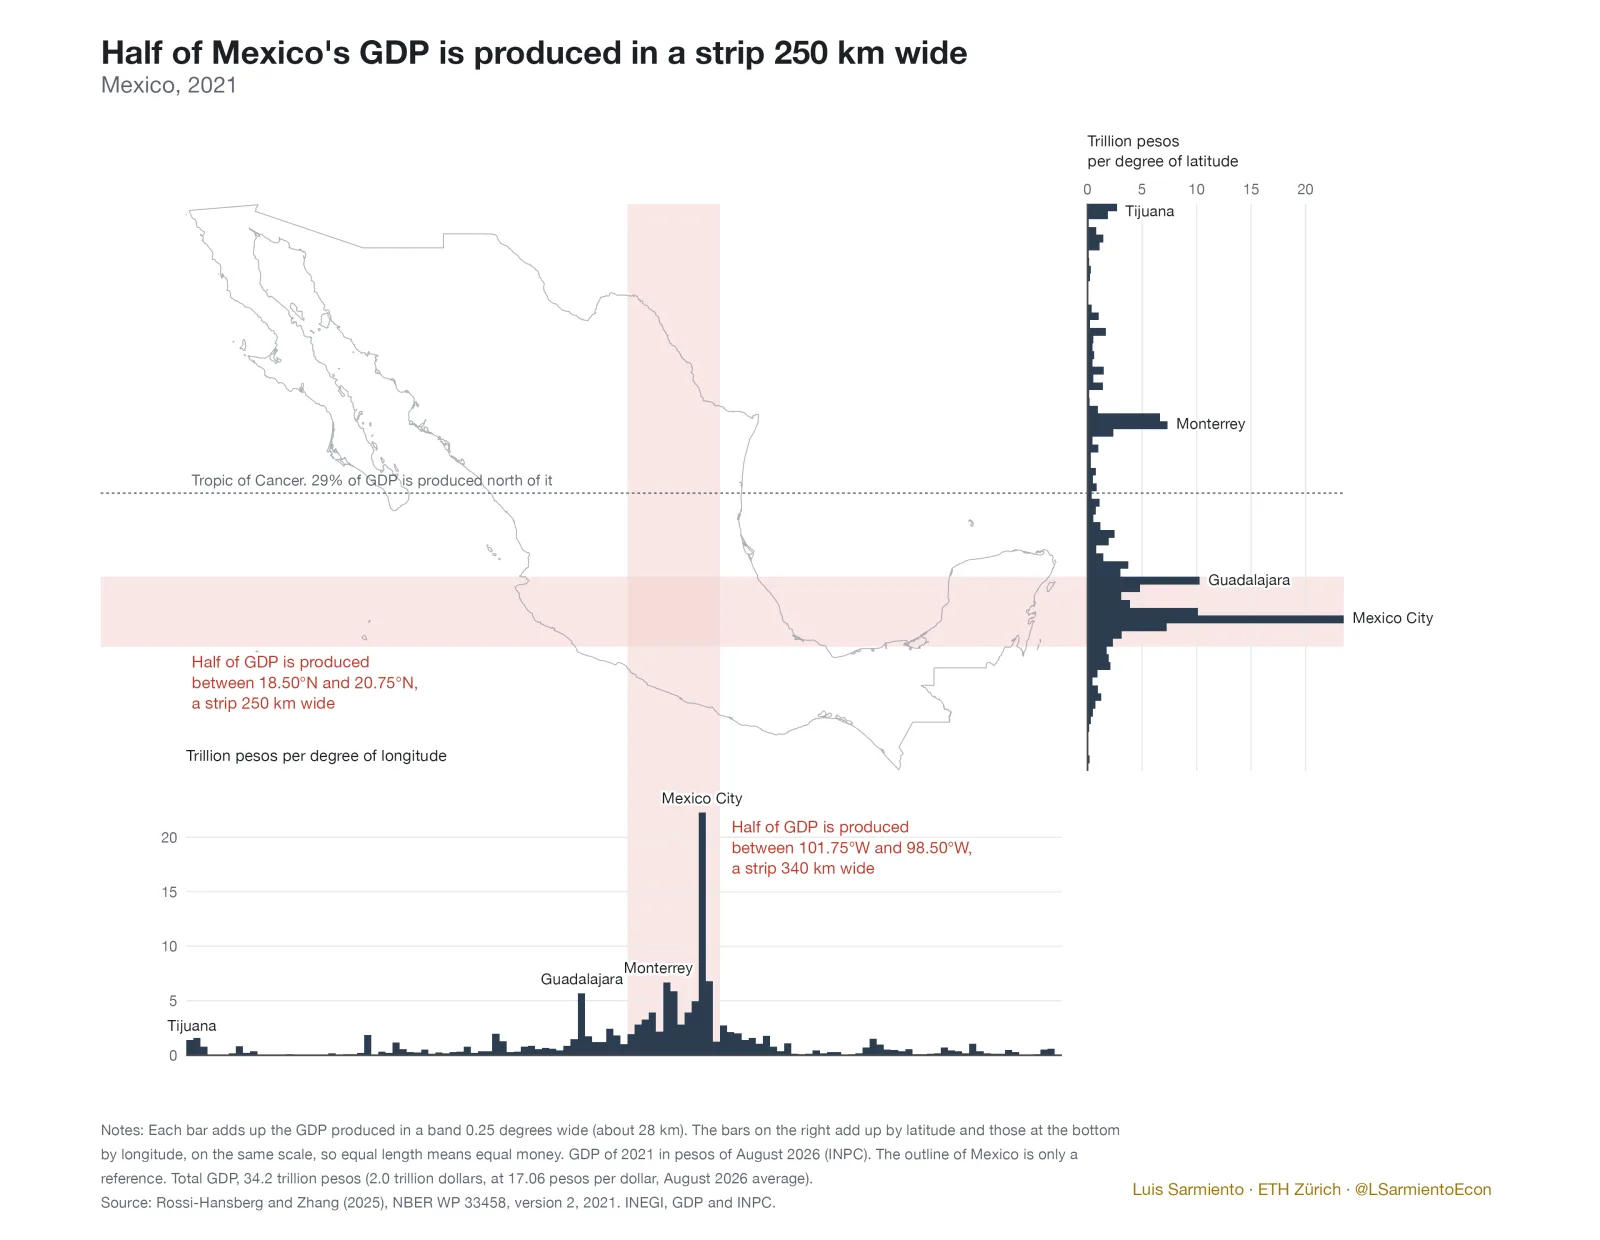
To see it, I added up the whole country's GDP by latitude and by longitude, using estimates of GDP in cells of about 28 km for 2021. The total is 34.2 trillion pesos of August 2026 (2.0 trillion dollars).
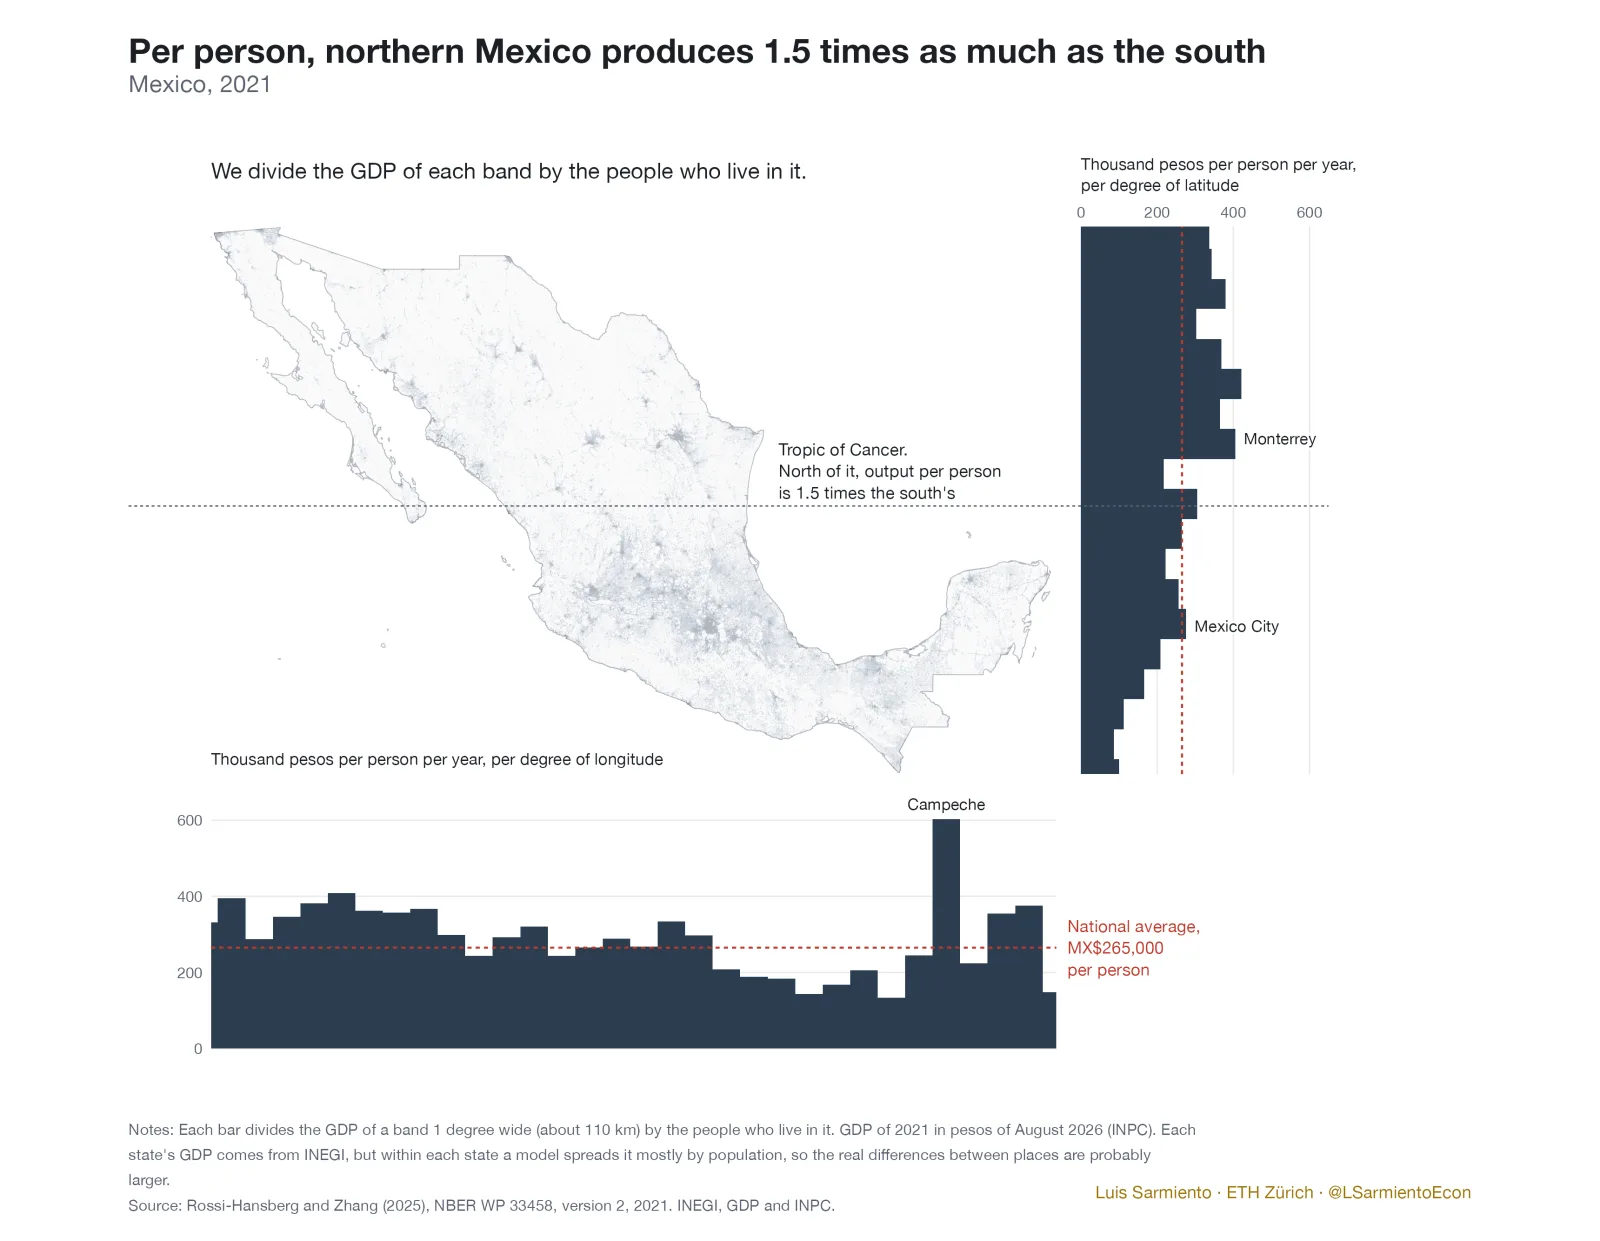
Half of the population also lives in that strip. If we divide each strip's GDP by the people who live in it, the centre stops standing out and GDP per person falls from north to south. North of the Tropic of Cancer lie 48% of the territory, 21% of the population and 29% of GDP, so each person there produces on average 1.5 times as much as one in the south. From east to west, the oil region of Campeche stands out.
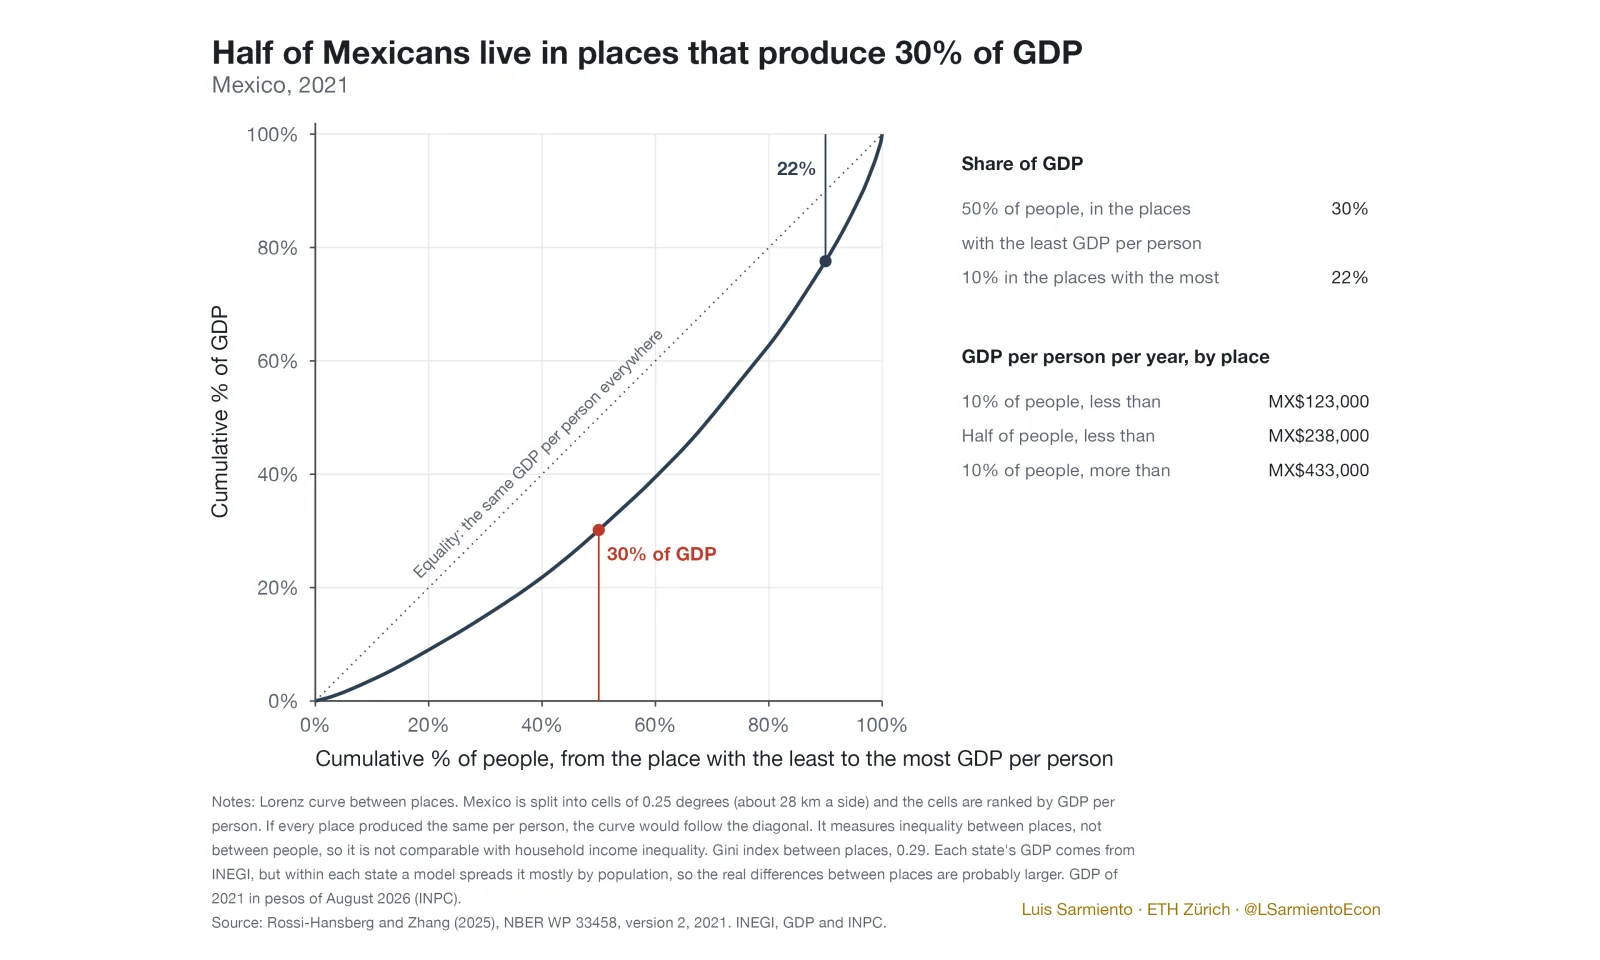
Place by place, output per person varies a lot. Half of Mexicans live in places that generate 30% of GDP, and the 10% who live where the most is produced generate 22%. There, GDP per person exceeds 433,000 pesos a year (25,400 dollars), against less than 123,000 pesos (7,200 dollars) in the bottom 10%. This is inequality between places, not between people, and it probably falls short, because within each state the source spreads GDP mostly by population.
Sources: Rossi-Hansberg y Zhang (2025), NBER WP 33458, versión 2, 2021. INEGI, PIB e INPC. WorldPop 2025. FRED.