Data
Short data threads on Mexico and Latin America, and interactive pages that put the numbers behind a research question in the reader's hands.
Data threads
Posted in Spanish on X and in English on LinkedIn. Each page holds the figures, the text and the code that produces every number.
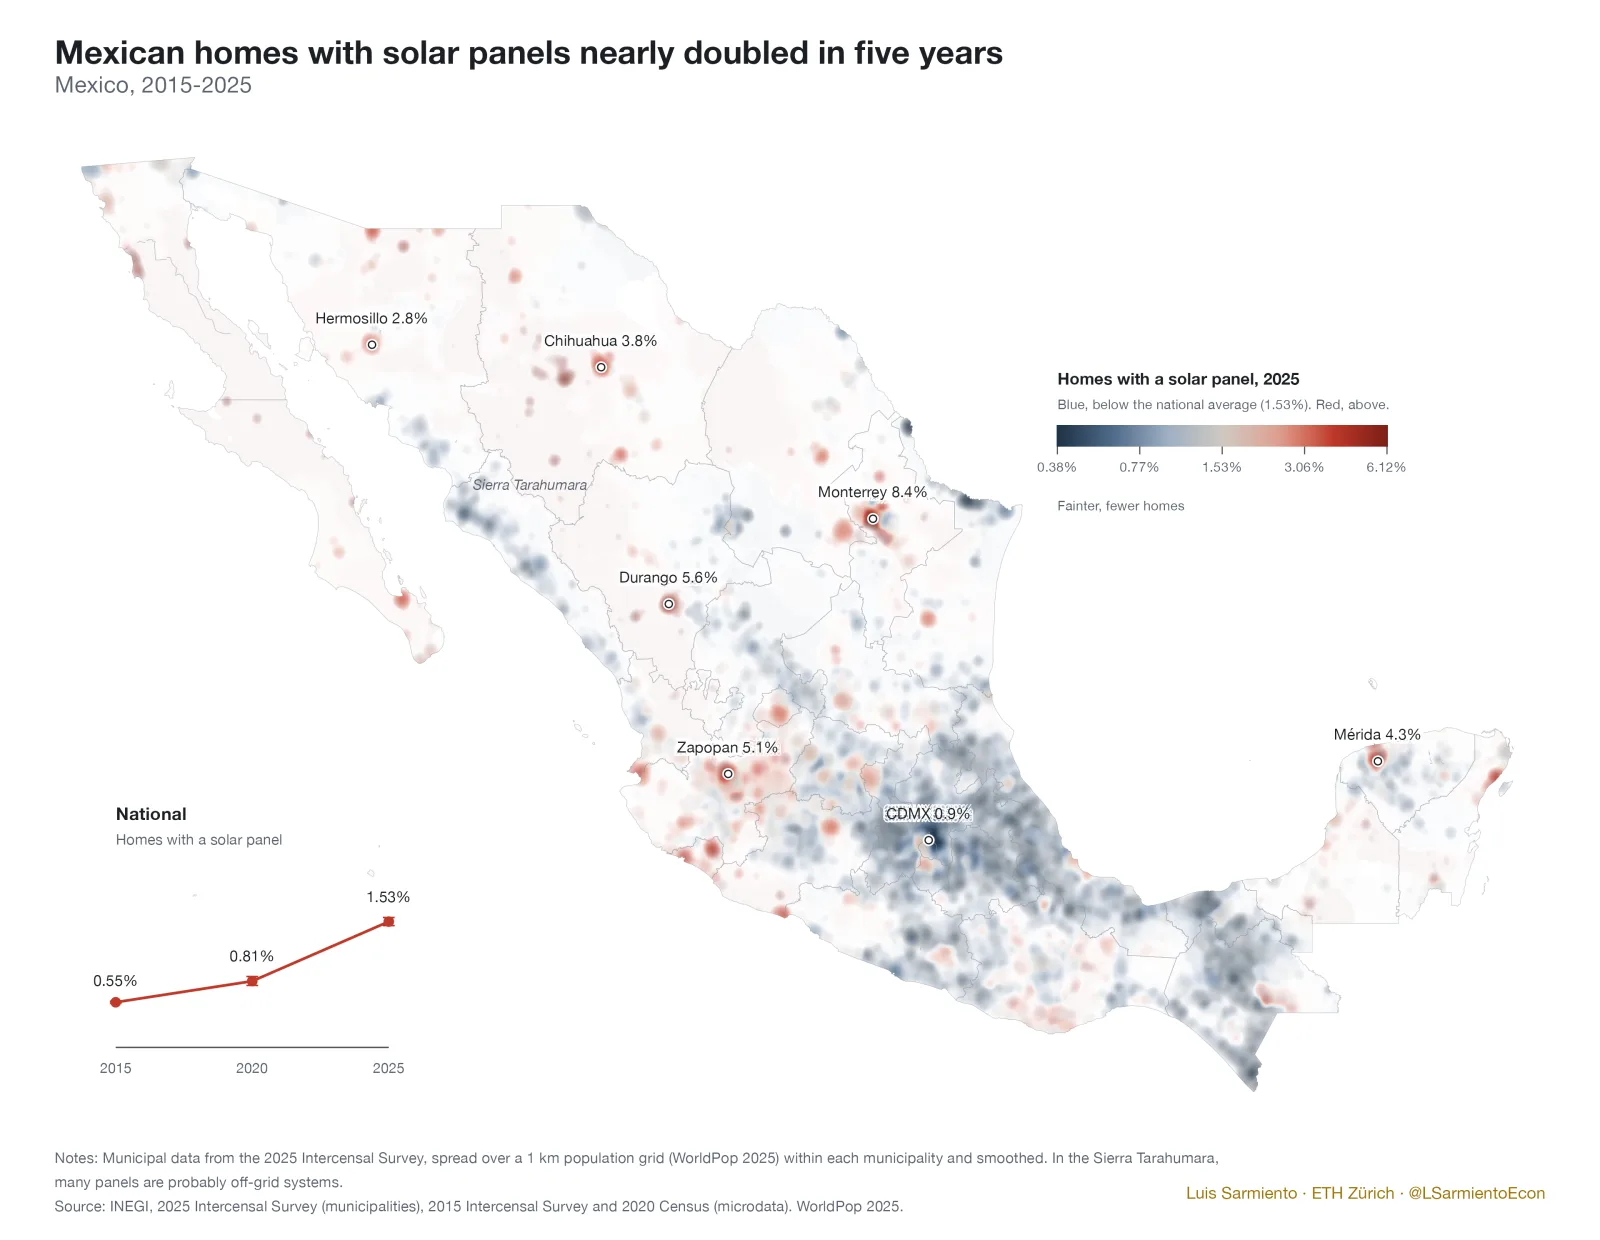
Who has solar panels in Mexico?
Mexican homes with solar panels nearly doubled between 2020 and 2025. Panels cluster at the top of the income distribution and in homes with air conditioning.
See the figures and the code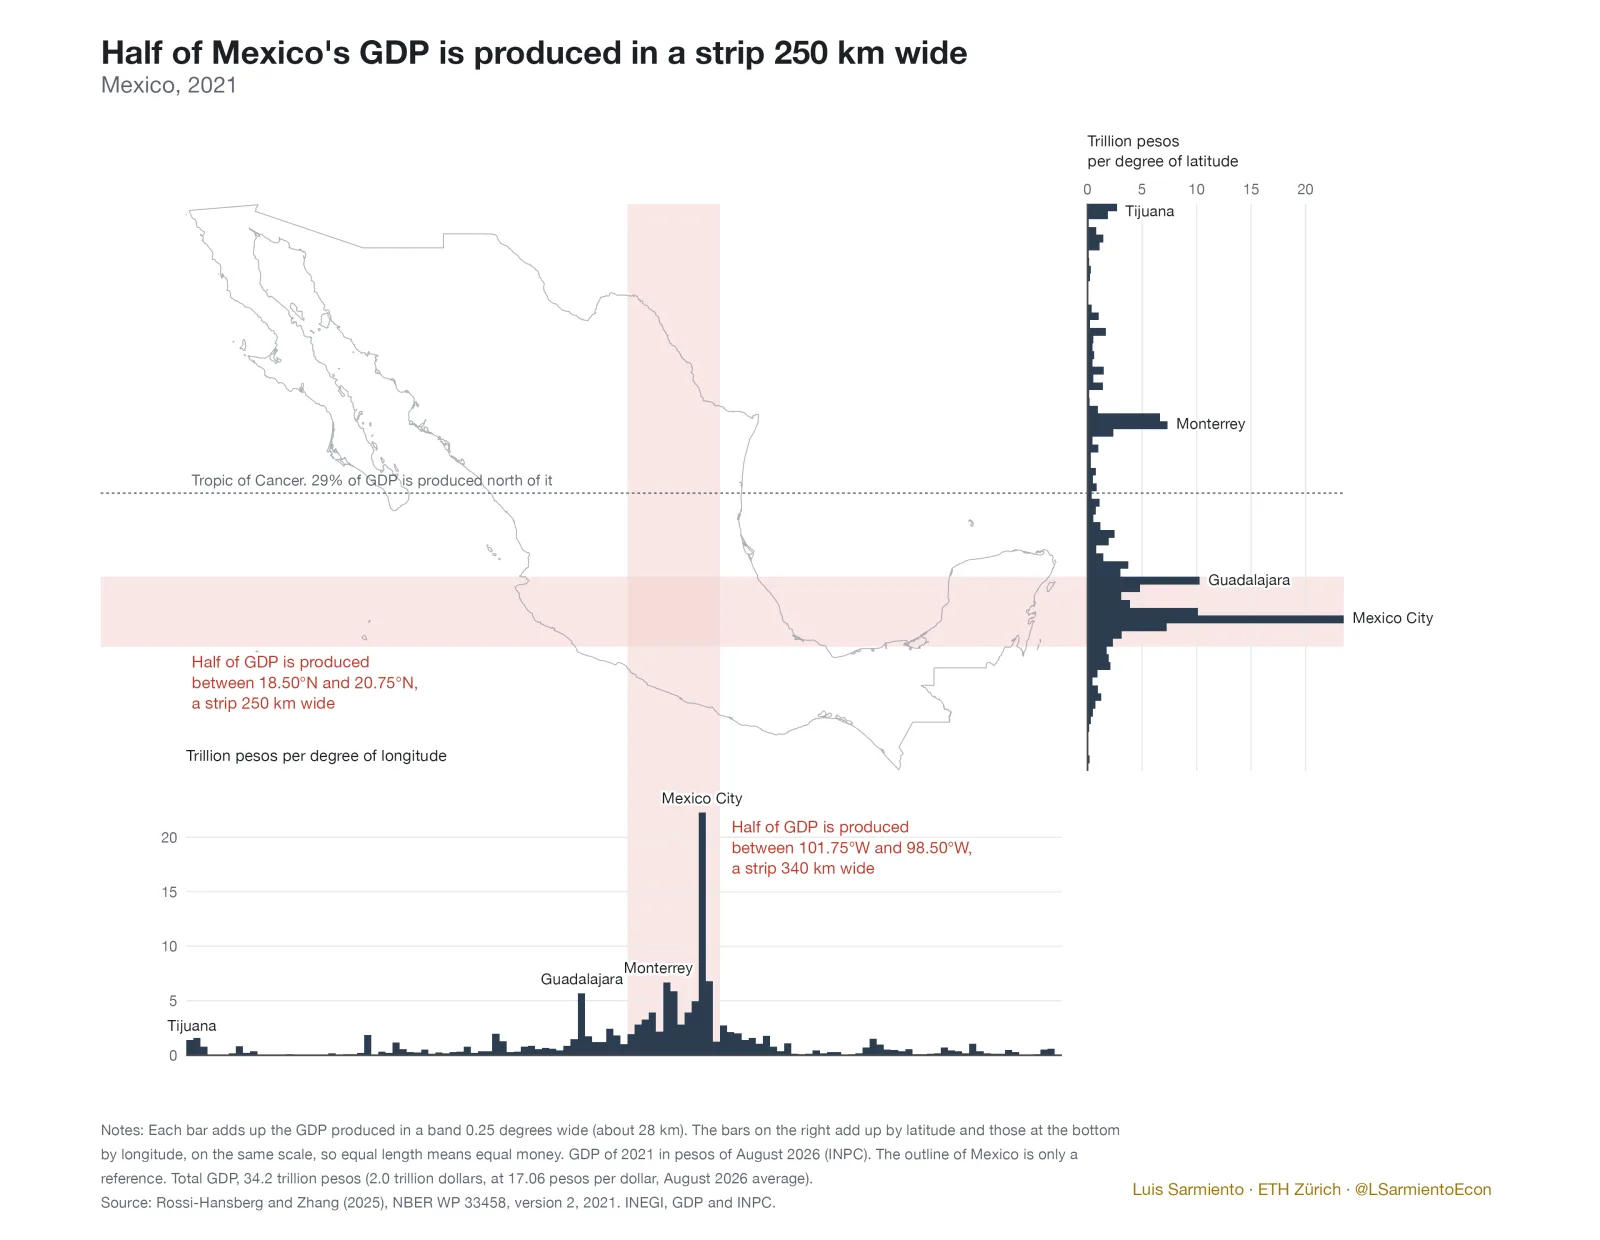
Where is Mexico's GDP produced?
Half of Mexico's GDP is produced in a strip 250 km wide, but per person the centre stops standing out and output falls from north to south.
See the figures and the codeInteractive tools
Temperature and emergency department visits in Mexico
How daily temperature moves emergency department visits across Mexico, from the universe of public hospitals, 2008 to 2021. Cold days reduce visits and the effect builds over the following month; hot days raise them on the day. Every figure is an estimate from the paper, with its confidence interval and the numbers behind it, by age, by diagnosis and projected to midcentury.
Companion to a paper published in the Journal of Economic Behavior & Organization. · 2026-08
Open the toolInteractive power calculatorAir purifiers in schools: sizing a second trial
How many schools would a second randomized trial of classroom air purifiers need to detect a given reduction in student absences, and at what cost. Every input is measured in our first Milan trial (5 schools, 95 classrooms); the page explains the design, the two data scenarios and the statistics in plain language.
Prepared for the Clean Indoor Air Initiative (Brown University). · 2026-08
Open the tool