Is Mexico really a hot country?
Referees often ask why temperature in Mexico is worth studying if the country is so hot. Three maps of its 1991 to 2020 climate show how uneven it is, with cities of the world for comparison.
Code on GitHubReferees often ask me what the international relevance is of studying the effects of temperature and climate change in Mexico when it is such a hot country (aka external validity).
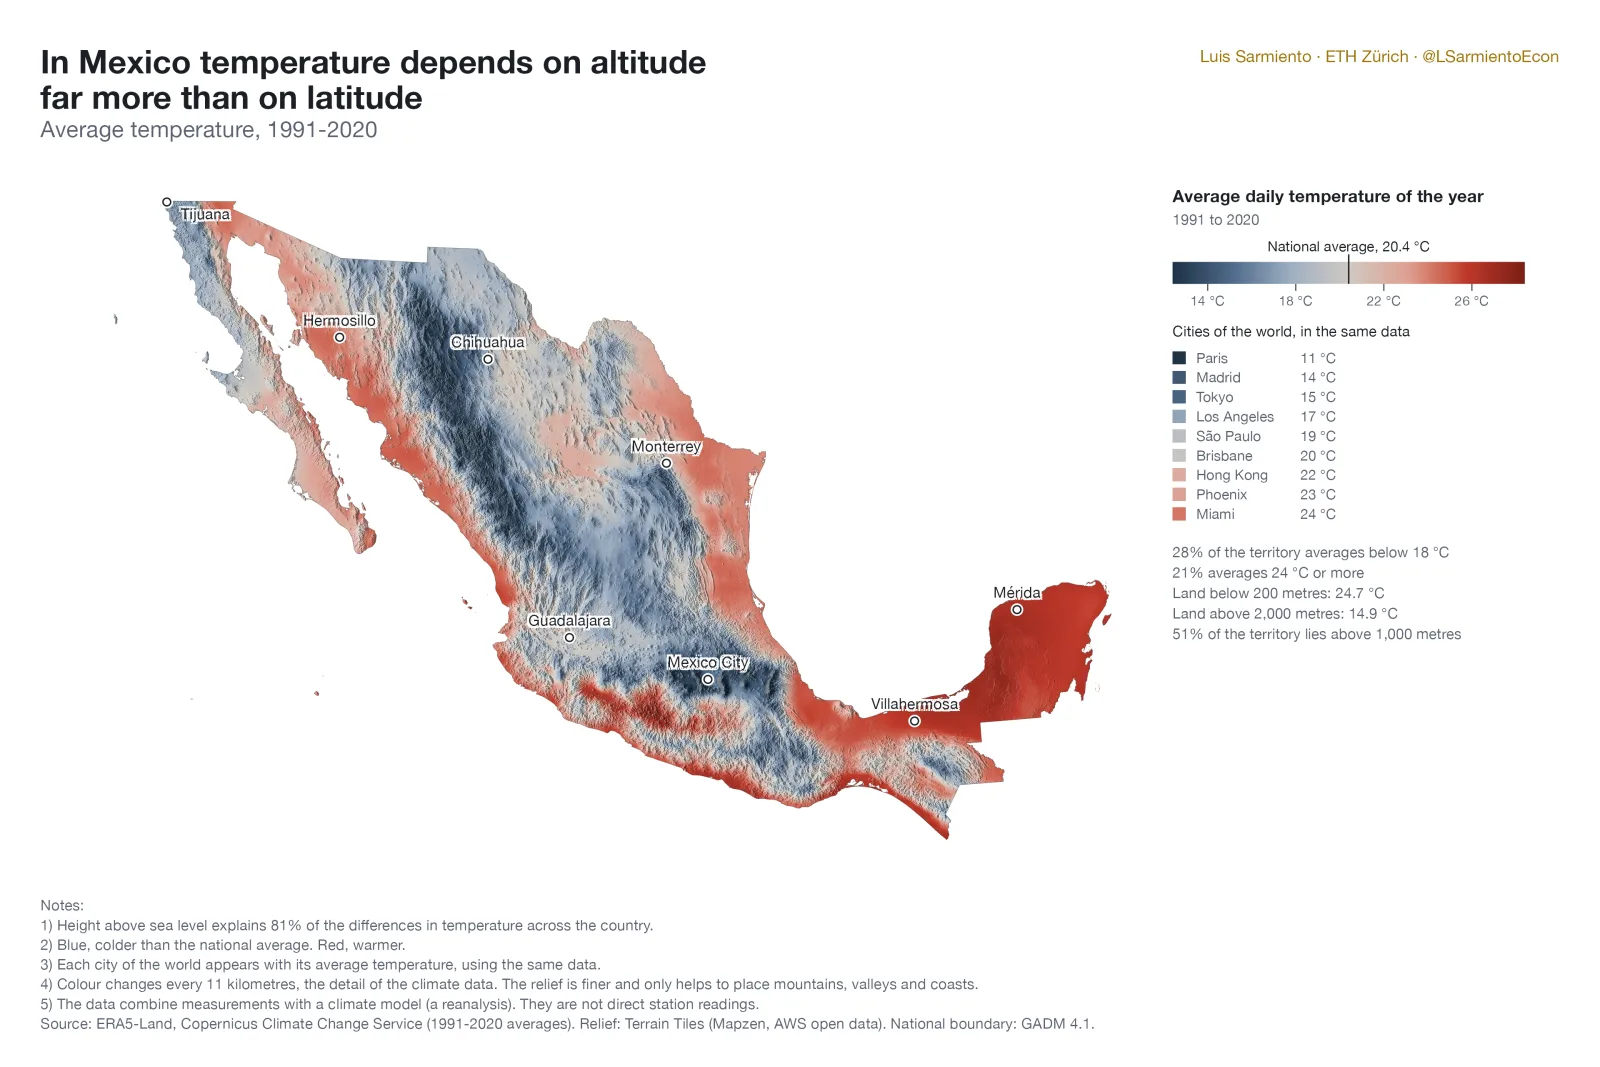
These maps are my answer. Mexico is not the hot desert Hollywood shows us. Some 28% of the territory averages below 18 °C and only 21% above 24 °C. Height above sea level explains 81% of the differences in temperature across the country, and half of the territory lies above 1,000 metres.
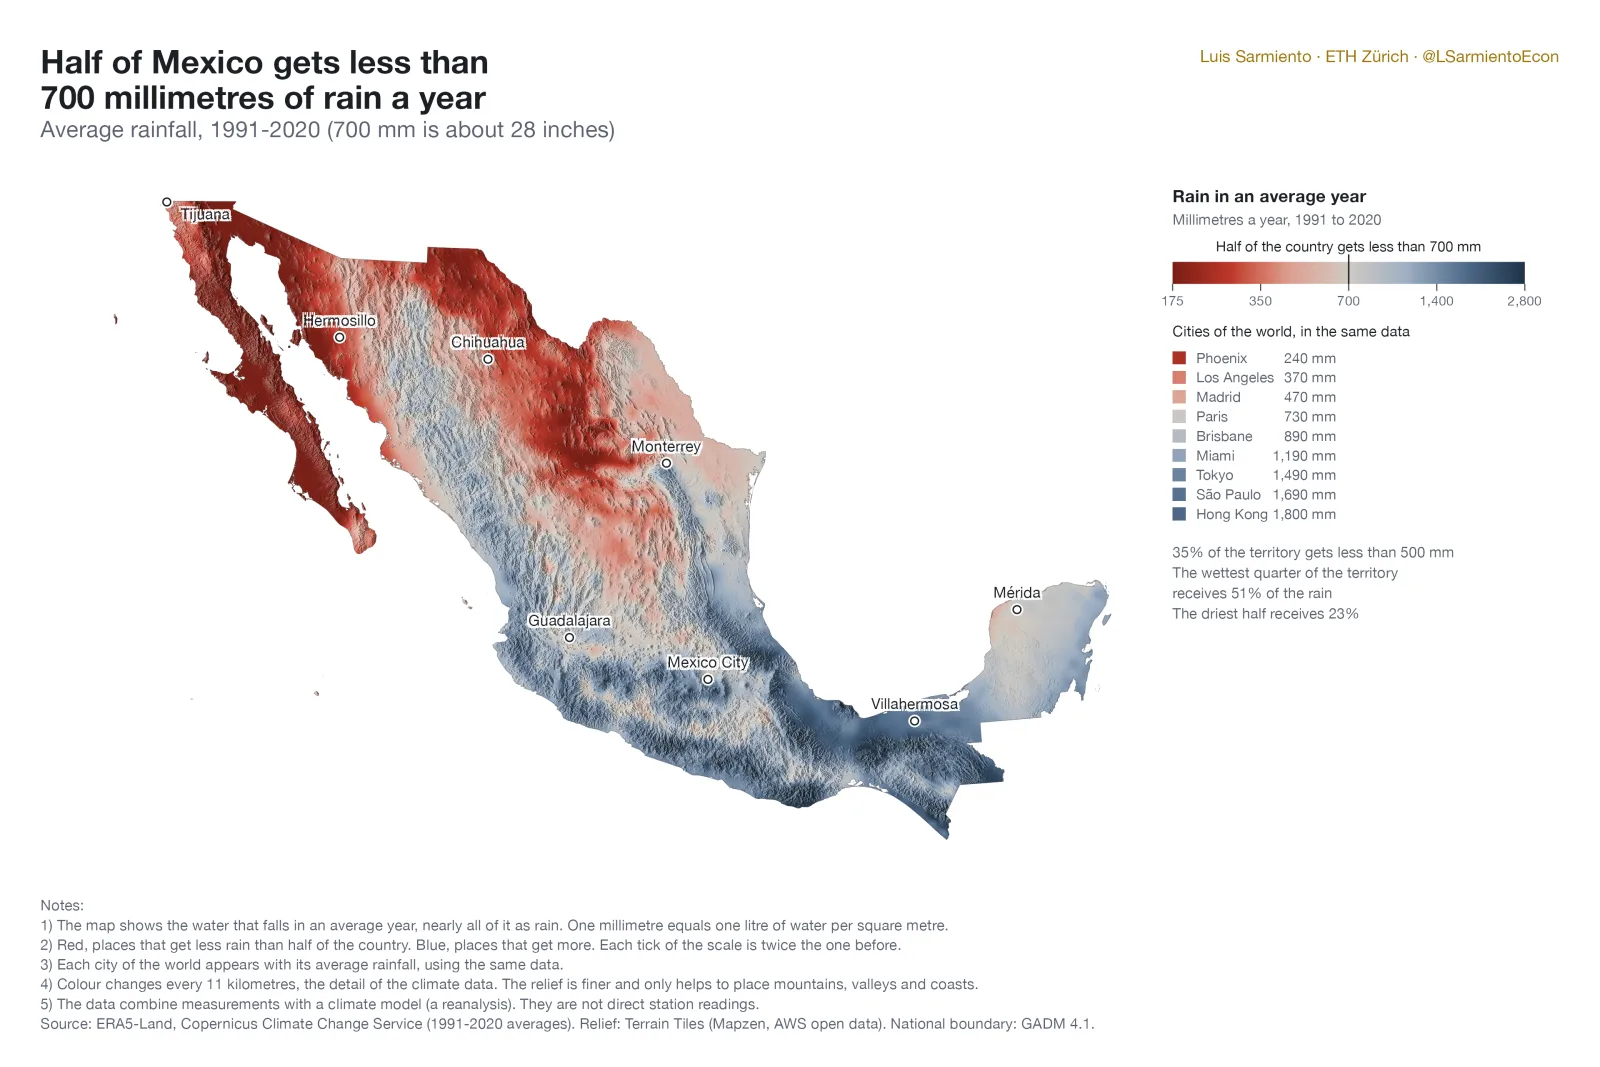
The distribution of rainfall is also quite uneven. In an average year, 14% of the territory gets less than 250 millimetres (about 10 inches) and another 14% gets more than 1,500. The wettest quarter of the country receives 51% of all the rain. The driest half receives 23%.
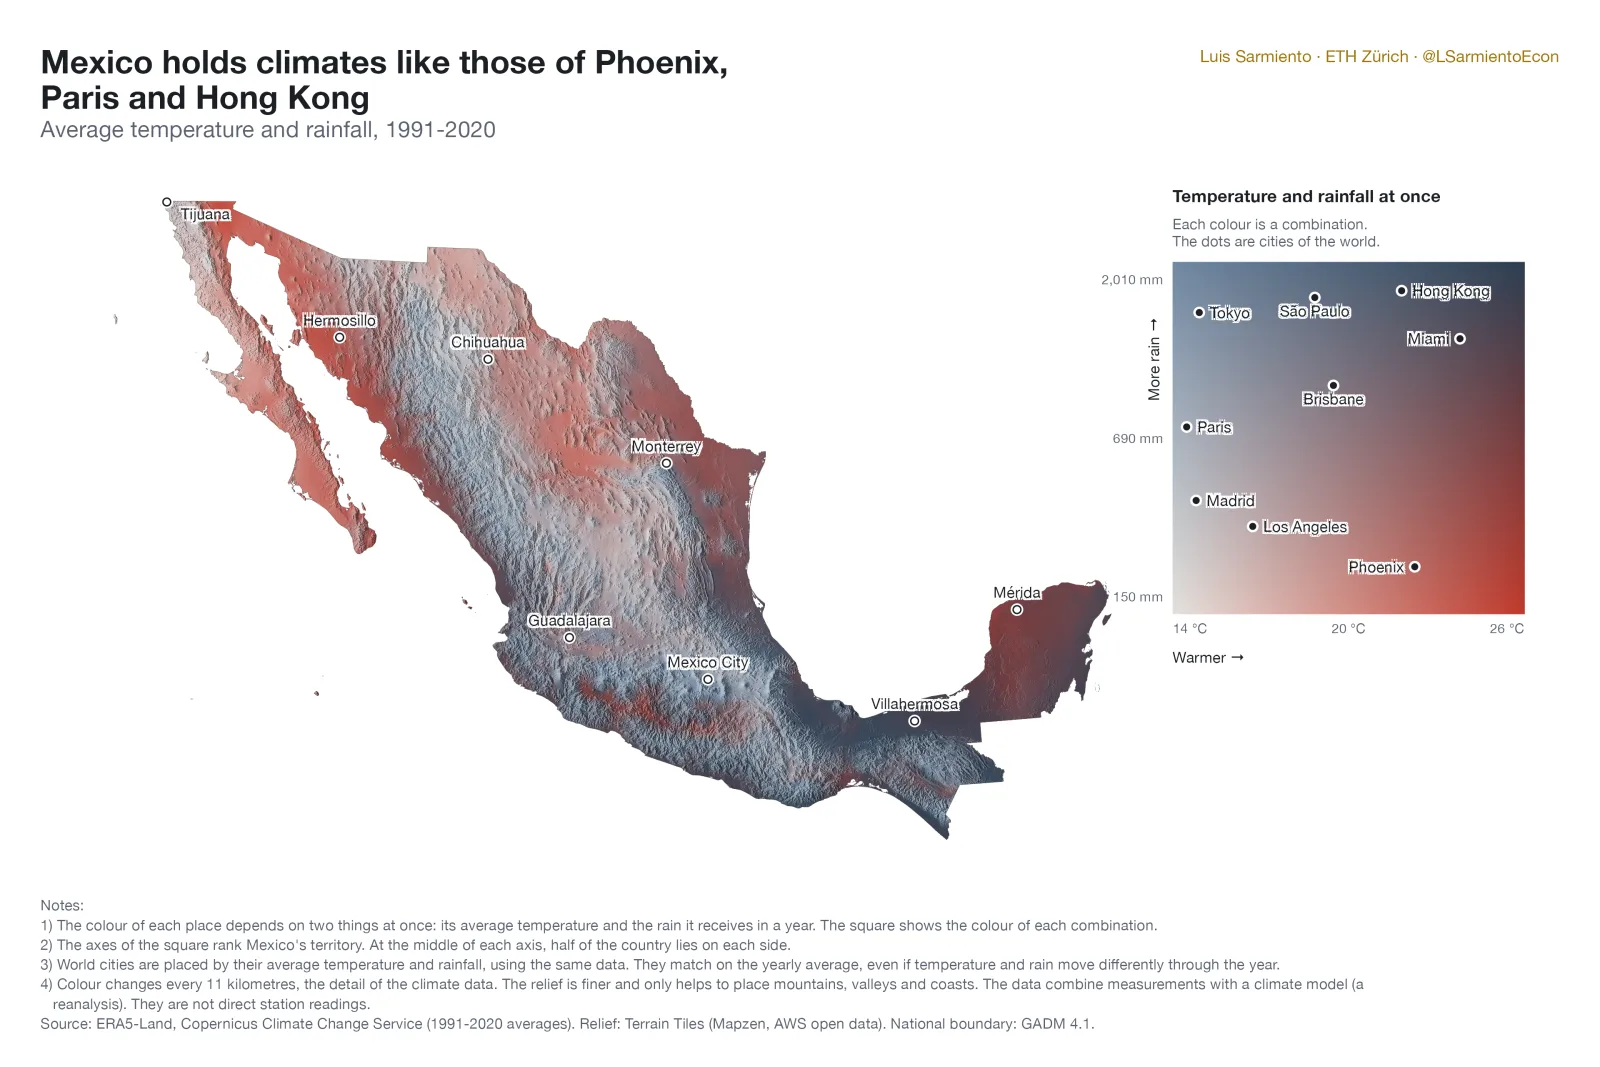
The third map shows both at once. In a single country there are 50,000 km² (about 1.2 times the size of Switzerland) with temperature and precipitation similar to those of Phoenix, 26,000 to those of Paris, and 65,000 to those of Hong Kong (within 1.5 °C and 20% of the rainfall).
The data are ERA5-Land, a reanalysis that combines measurements with a climate model, at about 11 km of detail. They are not direct station readings. The two-variable map follows an idea by Milos Popovic for the Iberian peninsula.
Sources: ERA5-Land, Servicio de Cambio Climático de Copernicus (promedios 1991-2020). Relieve: Terrain Tiles (Mapzen, datos abiertos en AWS). Límite nacional: GADM 4.1.